How are you guys collecting data and sharing it including attendance, groups, kids, etc.
Is everyone just using their CHMS (which)? Is anyone using churchmetrics.com or even Microsoft power apps with Power BI or something else?
1 Like
We use churchmetrics.com, and have been for a long time. It’s great, free and pretty easy to use. In some areas volunteers put in the data for me, which is awesome 
2 Likes
We’re using Fellowship One, but have modified it to track things like:
- where people are as disciples using the Real Life Ministries wheel
- measuring and tracking progress on connecting visitors
- measuring and
Tracking progress on the percentage of those in Life Groups, attendance in Life Groups, adult core classes, and progress toward completing our leadership development program
1 Like
Our goal is have all of the data come from our CHMS and ideally all reports and dashboards would come from there as well. We’re just rolling out Realm at our church and the reporting is still pretty immature. Basic reports and dashboard are there in Realm but I pull data into a Power BI data model in Excel and the Power BI Desktop and build dashboards from there. It’s the best way I’ve found to create a dashboard which can reflect the core metrics we’re developing for our metrics we’re tracking for the year and for the roll out of Realm.
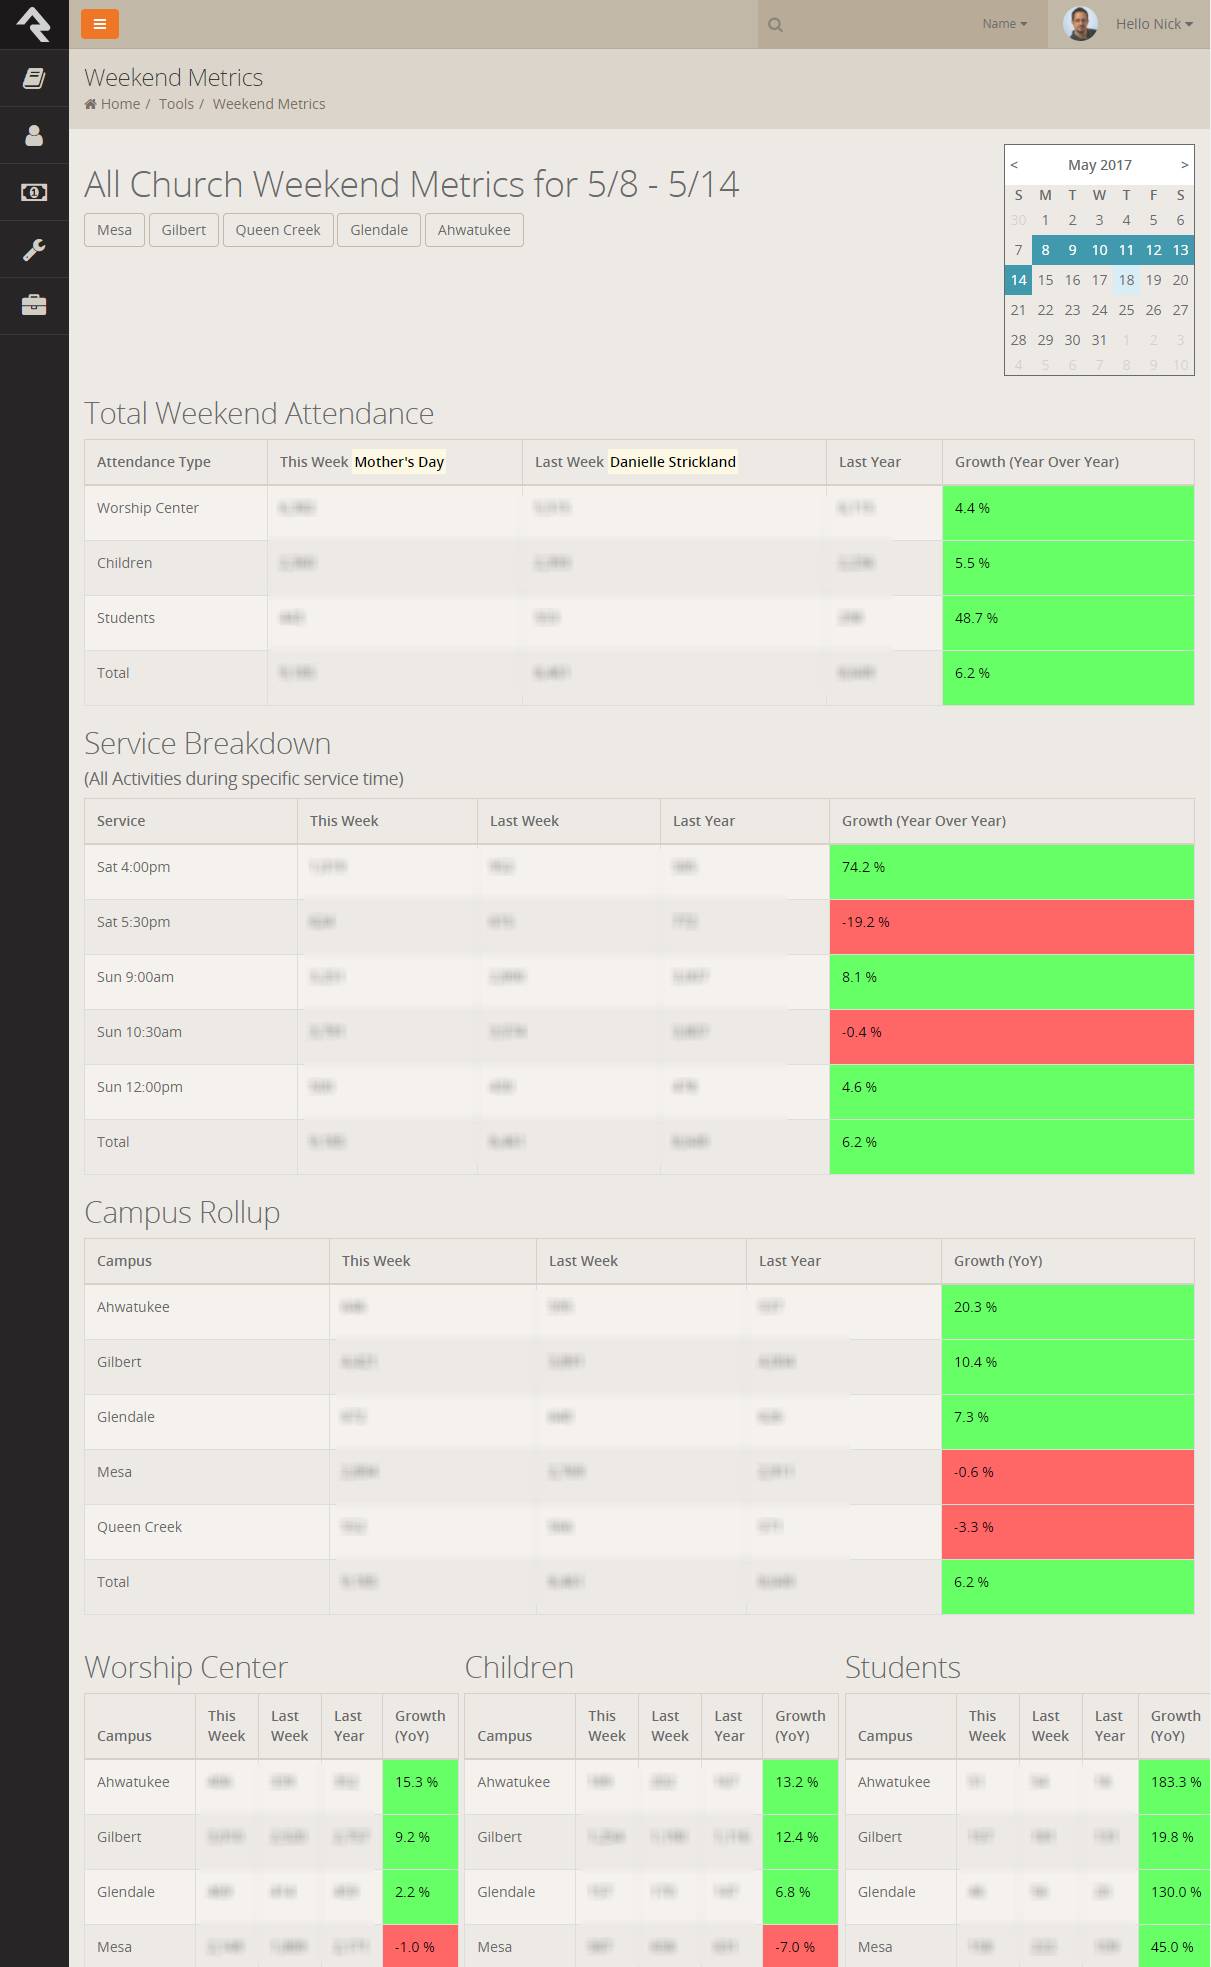
We’ve been using Church Metrics with a custom job (code) to import the data into our Rock RMS system, but we’re moving off CM in favor of direct entry into Rock’s metrics area. We also used Rock’s DynamicData block to create a custom dashboard for our executive team as seen here:
2 Likes
Nick that looks fantastic - you wouldn’t happen to have instructions on how you created that would you?
Well, without getting into too many gory details, it involved the following:
-
Creating several metrics (Childrens, Worship Center, etc) partitioned by campus and service time.
-
Putting a custom date picker that Taylor wrote on the page.
-
Adding multiple stock DynamicData blocks on the page - each one representing a summary of the data being looked at. Inside each of those DynamicData blocks we put a hairy SQL Query that extracts the metric data we’re summarizing and then using the block’s Formatted Output field to control how it’s displayed, such as this:
{% assign dayOfWeek = 'Now' | Date:'dddd' %}
{% assign hour = 'Now' | Date:'H' | DividedBy:1 %}
{% assign sundayDate = 'Now' | SundayDate %}
{% assign param =  'Global' | PageParameter:'SundayDate' %}

<h2>Total Weekend Attendance</h2>

<div class="grid">
<table class="grid-table table table-bordered table-striped table-hover">
		<thead>
			<tr align="left" data-original-title="" title="">
				<th data-priority="1" scope="col">Attendance Type</th>
				<th data-priority="1" scope="col">This Week
                    {%for row in rows %}
                        {% assign note = row.ThisWeekNotes | Trim %}
                        {% if note != '' %}
                            <mark>{{note}}</mark>
                        {% endif %}
                    {% endfor %}
				</th>
				<th data-priority="1" scope="col">Last Week
                    {%for row in rows %}
                        {% assign note = row.LastWeekNotes | Trim %}
                        {% if note != '' %}
                            <mark>{{note}}</mark>
                        {% endif %}
                    {% endfor %}
				</th>
				<th data-priority="1" scope="col">Last Year
                    {%for row in rows %}
                        {% assign note = row.LastYearNotes | Trim %}
                        {% if note != '' %}
                            <mark>{{note}}</mark>
                        {% endif %}
                    {% endfor %}
                </th>
				<th data-priority="1" scope="col">Growth (Year Over Year)</th>
			</tr>
		</thead>
		<tbody>

        {% if dayOfWeek == 'Saturday' and hour >= 16 %}
            <tr>
    		    <td colspan="5">
        		    <em><small class='text-muted'>Total Attendance will be available after 1pm on Sunday</small></em>
    			</td>
    		</tr>

        {% elseif dayOfWeek == 'Sunday' and hour < 13 %}
    		<tr>
    		    <td colspan="5">
        		    <em><small class='text-muted'>Total Attendance will be available after 1pm on Sunday</small></em>
    			</td>
    		</tr>

        {% else %}
        	<!-- Show row data -->
    		{%for row in rows %}
    			<tr align="left" data-original-title="" title="">
    				<td class="grid-select-cell" data-priority="1">{{row.AttendanceType}}</td>
    				<td class="grid-select-cell" data-priority="1">{{row.ThisWeek }}</td>
    				<td class="grid-select-cell" data-priority="1">{{row.LastWeek}}</td>
    				<td class="grid-select-cell" data-priority="1">{{row.LastYear}}</td>
    				{% if row.Growth < 0 %}
    				{% assign color = "#ff6666" %}
    				{% else %}
    				{% assign color = "#66ff66" %}
    				{% endif %}
    				<td class="grid-select-cell" data-priority="1" {% if row.Growth > 0 or row.Growth < 0 %}style="background-color:{{color}};"{% endif %}><p style="color:black">{{row.Growth | Format:'p1' }}</p></td>
    			</tr>
    		{% endfor %}

        {% endif %}
There’s been scope-creep over the past 4 months which is why there are all sorts of extra things going on in the formatting.
There’s probably more elegant ways of accomplishing this so I wouldn’t necessarily try to repeat what we’ve done here, but the building blocks concept is the key. There may even be some Rock 3rd party contractors that could be involved to help set something like this up for a church using Rock.
1 Like
Thanks Nick, I appreciate the info!!